
Class of 2023 Breakdown: Ivy League Admissions Rates
This admissions cycle, based on the schools who have shared their admissions data so far, Ivy League admissions rates have seemingly decreased across the board.
Not every school shares its admissions rate, but we’ve compiled the data that’s publically available to give you a glimpse of the admissions data for the Class of 2023:
BROWN UNIVERSITY

Brown University admissions highlights:
This cycle was its largest applicant pool in Brown’s history
Amount of first-generation admitted students increased this year
The effect of Brown’s Promise on admissions rates - “Having achieved an initial fundraising milestone, the University will replace loans with scholarship funds in financial aid awards, building on need-blind admissions and other initiatives to make a Brown education more accessible.”
Total Applicants: 38,674
Total Admitted: 2,551
Academic Standing: 94% in top 10% of their high school classes.
Diversity: 49% of applicants identify themselves as people of color
First Gen: 14% of admitted students (compared to 13% last year)
COLUMBIA UNIVERSITY

Columbia University admissions highlights:
Rate dropped from 5.51% to 5.1% this year
Record high number of applicants
Total Applicants: 42,569
Total Admitted: 2,190
CORNELL UNIVERSITY

Cornell University admissions highlights:
Only Ivy League with acceptance rate over ten: 10.6%
Received fewer applications than last year
Total Applicants: 49,118
Total Admitted: 5,183
Diversity: 32.2 % self-identified as underrepresented minorities; 54.9% people of color
First Gen: 670
Gender: 54.9% women
DARTMOUTH COLLEGE

Dartmouth College Admissions highlights:
Record high applications
Highest number of first generation students to date
Total Applicants: 23,650
Total Admitted: 1,868
Diversity: 51% of admitted US citizens are people of color
First Gen: 16%
Legacy: 9%
HARVARD UNIVERSITY

Harvard University admissions highlights:
4.5% admissions rate is Harvard’s “lowest ever”
Diversity continues to increase
Total Applicants: 43,330
Total Admitted: 1,950
First Gen: 16.4%
Gender: 50% women (The Harvard Gazette)
PRINCETON UNIVERSITY
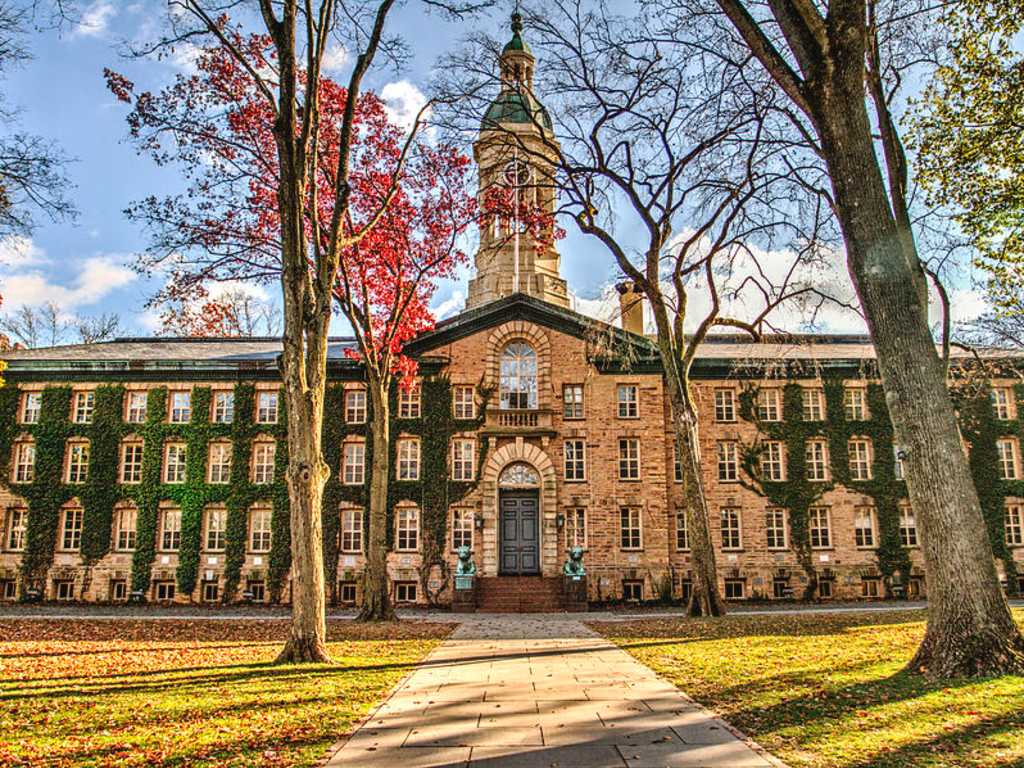
Princeton University Admissions highlights
5.77% admissions rate , up from last year
Started a transfer admissions program that “encourages applications from students from low-income backgrounds, community college students and U.S. military veterans. “
Total Applicants: 1,895
Total Admitted: 32,804
Diversity: 56% self-identified as people of color
Gender: 52% women
First Gen: 18%
Legacy: 11%
UNIVERSITY OF PENNSYLVANIA
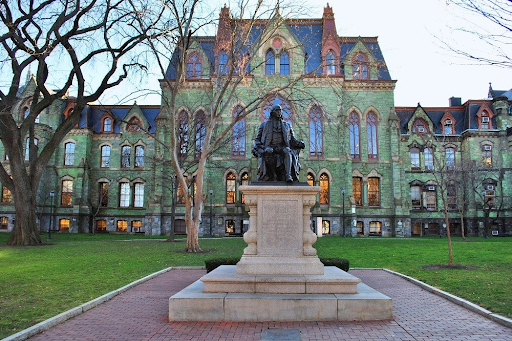
University of Pennsylvania admissions highlights:
7.4% admission rate
“The University meets 100 percent of demonstrated need for four years with grant funding and work-study”
Total Applicants: 44,960
Total Admitted: 3,345
Diversity: 51% U.S. Citizens/Permanent Residents self-identify as people of color
First Gen: 15%
Gender: 51% women
YALE UNIVERSITY

Yale University admissions highlights:
5.91 acceptance rate
Third “expanded class” admitted
Total Applicants: 36,843
Total Admitted: 2,178
Academic Standing:
Diversity: Increased this year
First Gen: Increased this year
Featured

6 Essay Topics To Avoid for Your College Admissions Essays


Featured